| 일 | 월 | 화 | 수 | 목 | 금 | 토 |
|---|---|---|---|---|---|---|
| 1 | 2 | 3 | ||||
| 4 | 5 | 6 | 7 | 8 | 9 | 10 |
| 11 | 12 | 13 | 14 | 15 | 16 | 17 |
| 18 | 19 | 20 | 21 | 22 | 23 | 24 |
| 25 | 26 | 27 | 28 | 29 | 30 | 31 |
Tags
- Aegis
- gameplay ability system
- gameplay effect
- MAC
- gameplay tag
- 언리얼엔진
- Replication
- Unreal Engine
- UI
- 게임개발
- CTF
- C++
- widget
- photon fusion2
- Multiplay
- rpc
- 게임 개발
- 보안
- os
- linear regression
- 유니티
- stride
- ability task
- listen server
- attribute
- animation
- 언리얼 엔진
- unity
- local prediction
- gas
Archives
- Today
- Total
Replicated
로지스틱 회귀 구현 본문

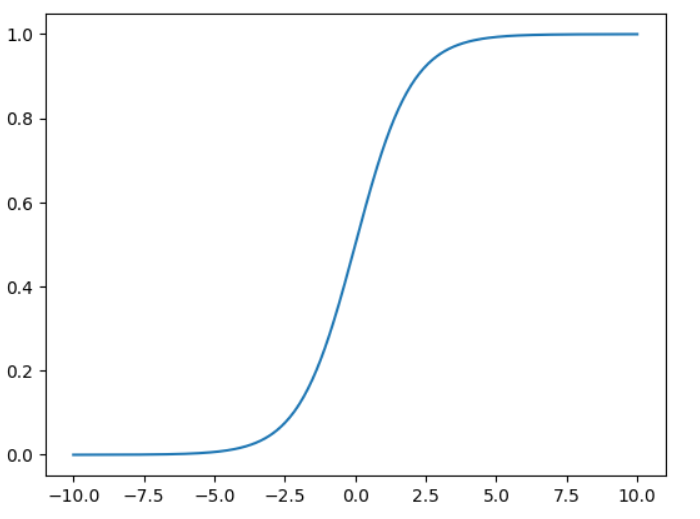
def sigmoid(z):
  return 1/( 1 + np.exp(-z) )
import matplotlib.pyplot as plt
x = np.linspace(-10, 10, 400)
y = sigmoid(x)
plt.plot(x, y, label="Sigmoid Function")
이렇게 그려짐
가설함수

- 시그모이드 함수의 z -> 가중치와 피쳐의 선형 결합임
- 피쳐 값들을 x 벡터, 가중치 값들은 세타로 입력
def hypothesis_function(x, theta):
  z = (np.dot(x,theta))
  return sigmoid(z)
벡터 dot 시 알아서 내적임
비용함수

def compute_cost(x, y, theta):
	m = y.shape[0]
	J = (-1.0 / m) * (y.T.dot(np.log(hypothesis_function(x,theta))) + \
						(1-y).T.dot(np.log(1- hypothesis_function(x,theta))))
	return J
예시
인터넷 사용자가 뉴비인지 아닌지 구분
import pandas as pd
data_url= "http://www-stat.wharton.upenn.edu/~waterman/DataSets/uva.txt"
df = pd.read_table(data_url)
df[:5]
df.pop('who')
df.pop('Country')
df.pop('Years on Internet')

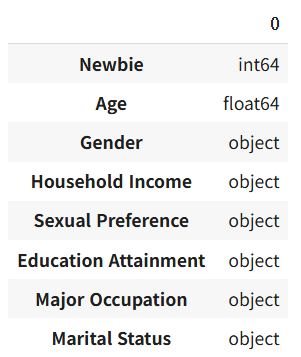
df.dtypes
필요없는 데이터 드롭
인터넷 몇 년 했는지는 너무 결정적인 값이라 제외
category_cols = ["Gender", 'Household Income', 'Sexual Preference', 'Education Attainment', 'Major Occupation', "Marital Status"]
for col in category_cols:
  df[col] = df[col].astype('category')
df.dtypes
데이터 타입 카테고리로 변환
df_onehot = pd.get_dummies(df)
df_onehot.shape
get_dummies 하면 1, 0으로 표현됨
df_onehot.isnull().sum()
Age가 널인게 좀 있음
df_onehot.loc[pd.isnull(df_onehot['Age']), "Age"] = df_onehot['Age'].mean()널인 거에는 평균 넣어주기
x_data = df_onehot.iloc[:, 1:].values
y_data = df_onehot.iloc[:, 0].values.reshape(-1, 1)
y_data.shape, x_data.shape
실제값 y로 분리
from sklearn import preprocessing # Min-Max Standardzation
min_max_scaler = preprocessing.MinMaxScaler()
x_data = min_max_scaler.fit_transform(x_data)
전처리, 스케일링
from sklearn.model_selection import train_test_split
X_train, X_test, y_train, y_test = train_test_split(x_data, y_data, test_size=0.33, random_state=42)
X_train.shape, X_test.shape
트레인 데이터, 테스트 데이터 스플릿
from sklearn.linear_model import LogisticRegression
logreg = LogisticRegression(fit_intercept=True)
logreg.fit(X_train, y_train.flatten())
로지스틱 리그레션
LogisticRegression(C=1.0, class_weight=None,
                   dual=False, fit_intercept=True,
                   intercept_scaling=1, l1_ratio=None, max_iter=100,
                   multi_class='warn', n_jobs=None, penalty='12',
                   random_state=None, solver='warn', tol=0.0001,
                   verbose=0, warm_start=False)
로지스틱 리그레션 다양한 지정 가능

테스트 데이터셋에서 5행만 프레딕트

각각 0일 확률, 1일 확률
from sklearn.metrics import confusion_matrix
from sklearn.metrics import accuracy_score
y_true = y_test.copy()
y_pred = logreg.predict(X_test)
confusion_matrix(y_true, y_pred)
혼동행렬

정확도 계산
'학부 > 빅데이터마이닝' 카테고리의 다른 글
| 다중클래스 분류의 코드 구현 (0) | 2025.04.12 |
|---|---|
| 다중클래스 분류 & 소프트맥스 분류 (0) | 2025.04.12 |
| 분류 문제의 성능 지표 (0) | 2025.04.12 |
| 로지스틱 회귀 (0) | 2025.04.11 |
| 과대적합과 정규화 (0) | 2025.04.11 |


